
April 2019
=STRATEGIC_SOURCING (A2:ZZ32000,2,FALSE)
21/04/19 - 14:51 Filed in: Procurement
This job advert caught my eye:
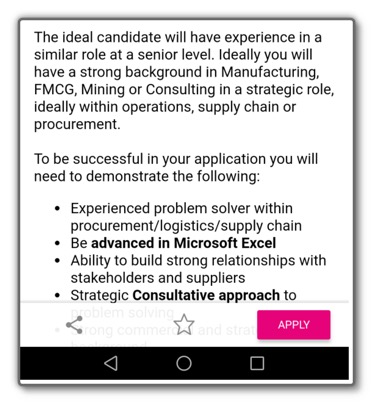
The role is a senior strategic sourcing role, (not an analyst role). Look at the second bullet point.
- Be advanced in Microsoft Excel
Five words that reveal so much! Firstly, what do you think is the relevance of Microsoft Excel to a senior strategic sourcing role? It’s in the mix somewhere, isn’t it? But the second bullet point?
I will go out on a limb here and say that an ability to analyse data is important for many procurement roles, but an ability to analyse data and being ‘advanced’ in Microsoft Excel are not the same thing.
A senior strategic sourcing role requires the ability to interpret data. An obvious example is spend analysis. You would expect a sourcing practitioner to be able to capture the spend data, and - assuming there are no analysts in the organisation - cleanse and analyse the spend. But the real value is in opportunity analysis; what does the data mean? Which categories could be managed differently to release some value? What is the scale of the potential benefit, and how easy or difficult will it be to access that value? None of those judgements are directly related to an ability to use pivot tables.
The second issue that I have is with the definition; ‘advanced in Microsoft Excel’. If I asked you to develop an assessment task to establish the actual level of capability of a candidate, what would the task be, and what would be the threshold that you would calibrate as ‘advanced’? Given the widespread belief that candidates inflate their actual capability, how would you validate that a candidate really does have ‘advanced’ capability in Excel?
Now you may think that I am getting overexcited about a single job advert. (And you may be right!) But what then, do you make of this advert?
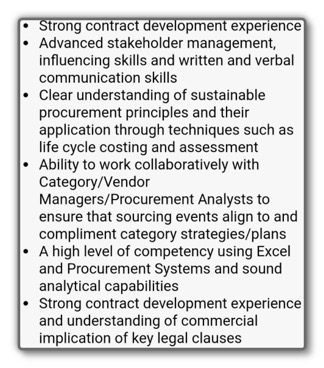
This is for a senior sourcing role in a University. Universities are among the most challenging cultures for professional service practitioners to operate it. Business cards for key decision makers have to be A5 in size to fit in all of their qualifications and academics operate in a culture of intellectual freedom. The key capabilities that underpin success for sourcing practitioners in this context are interpersonal skills. The ability to build rapport, engage and influence stakeholders, and build a ‘guiding coalition’ to support initiatives. To be fair, the advert does mention collaboration, (though with procurement peers). But what’s that?
- “A high level of competency using Excel and Procurement Systems and sound analytical capabilities”
At least the capabilities mentioned include the ability to analyse, not just a facility with Excel. And in this organisation, the level of capability needed is not ‘advanced’. It’s only ‘high’. Phew! I may stand a chance, then! And ‘contract development experience’ is so important it gets mentioned twice. Maybe it is doubly important?
I know it is easy to criticise, so I will list what I believe are some generic capabilities positively correlated with actual strategic sourcing behaviour, rather than data analysis or tactical procurement. Before I do that, let me say that I think these two adverts show:
The commoditisation of the recruitment services industry by the growth of SEEK and LinkedIn and, yes, by procurement processes squeezing rates - has led to recruiters spending less time on each job. These ads may be the result of wafer-thin rates.
These job adverts demonstrate that the people who wrote them know next to nothing about procurement
I have little confidence that recruitment and selection processes based upon the published criteria will select suitable candidates for the roles
The preoccupation with Excel in people specifications is a symptom of the failure of the procurement profession to communicate what it is that we do, or how we do it, to other professions.
To be more constructive, here are three domains of capability relevant to procurement roles:
Manage procurement; we must be capable of managing the procurement process
Manage people; we must be capable of influencing and managing relationships with peers, stakeholders and suppliers
Manage the business; we must be capable of aligning our contribution to the goals of the organisation
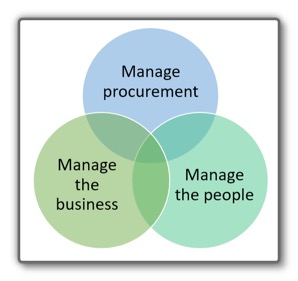
Here is a simple graphic to visualise the three domains of capability. The job adverts reflect that procurement people can’t just be good at procurement, we also need to be able to relate to others. And if the business sees no value in what we do?
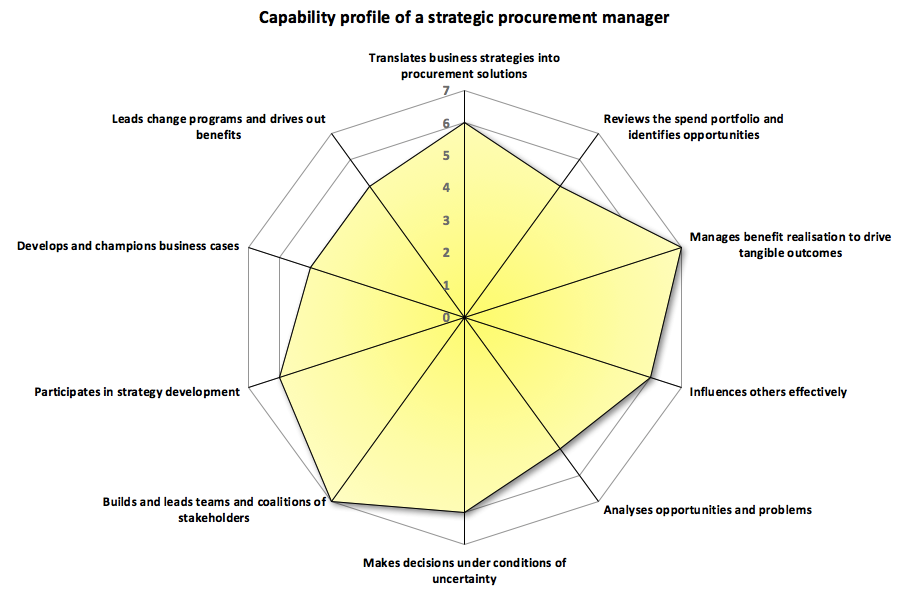
We all know the consequences of that, because it is often all too prevalent. I have listed some specific capabilities in each domain, and as a target I have myself a maximum of ten. This is for a senior strategic sourcing role, (the same as in the two adverts)
Manage procurement
Translates business strategies into procurement solutions
Reviews the spend portfolio and identifies opportunities
Manages benefit realisation to drive tangible outcomes
Manage the people
Influences others effectively
Analyses opportunities and problems
Makes decisions under conditions of uncertainty
Builds and leads teams and coalitions of stakeholders
Manage the business
Participates in strategy development
Develops and champions business cases
Leads change programs and drives out benefits
Do you agree? By all means add some you think are important, but remember to take away one capability for each capability that you add. More than ten capabilities is more than enough! I am experienced in developing capability frameworks and in diagnosing capability. I have developed capability diagnostics for procurement practitioners and for human resource practitioners, and I have developed capability frameworks for many different organisations
Easter egg
You are still reading? Here is an actual job advert I spotted a few weeks ago. Enjoy!
To be successful in your application for this engaging and exciting new opportunity the candidate will be a decisive and proactive team player and will have a demonstrated ability to work autonomously, to manage multiple priorities in a fast-paced environment and provide innovative solutions to complex issues. The ability to identify strategic alignment and identify and drive continuous improvement activities whilst engaging and influencing others to achieve operational excellence will be paramount in this role. Additionally you will ideally have experience of working within a technical engineering environment and be able to effectively build and manage partnerships with key internal and external stakeholders in order to deliver value from strategic partnerships, innovation and to support to REDACTED growth aspirations.
Peter Price and Valerie Value
21/04/19 - 14:46 Filed in: Procurement

Peter Price
If you listen to sales people, they will tell you about Peter Price. They meet Peter all the time. He might work in your organisation. Here's how you recognise Peter;
"Can you sharpen your pencil?"
"The spec is the spec. Let's talk about your price…"
"I understand that you believe your solution is special. Now about your price…"
"Have another look at your pricing"
"If you can't give me the pricing I need, I'll have to look elsewhere"
Main metrics are price savings
It's all very well us procurement practitioners talking about 'strategic procurement', but I cringe when i hear some of the stories about encounters with Peter. Now there are times when all of us have channelled our inner Peter, not because we wanted to, but because we had to. The budget wasn't there. We were under time pressure. I plead guilty, too.

Valerie Value
For us to have credibility as a profession, we have to be able to add value over and above navigating procurement governance or chiselling rates. Even Mr Magoo could see that artificial intelligence and machine learning will eliminate the role of Keeper of the Mysteries of Procurement Governance, and even existing technologies can create and harness competition quicker and more efficiently than Peter.
Valerie equates value to the benefits realised from a procurement project as a ratio of the cost of realising those benefits. Imagine we described the benefits realised from a procurement as being 'above the line' and the cost of realising those benefits as 'below the line'. Peter operates almost exclusively below the line. Valerie understands the business, and the business impact of the procurement.
This means that she can engage in discussion about whether a higher priced alternative is 'worth the extra', because she is aligned with stakeholders who can make a judgement as to whether the extra functionality is worth the extra money. By this stage, Peter has used up aphorisms about 'sharpening your pencil', and 'looking at your pricing' and has resorted to asking the other party to 'come to the party'. Some party. It makes us look like amateurs.
To be constructive, I have created a model to track whether we are more like Peter or like Valerie.
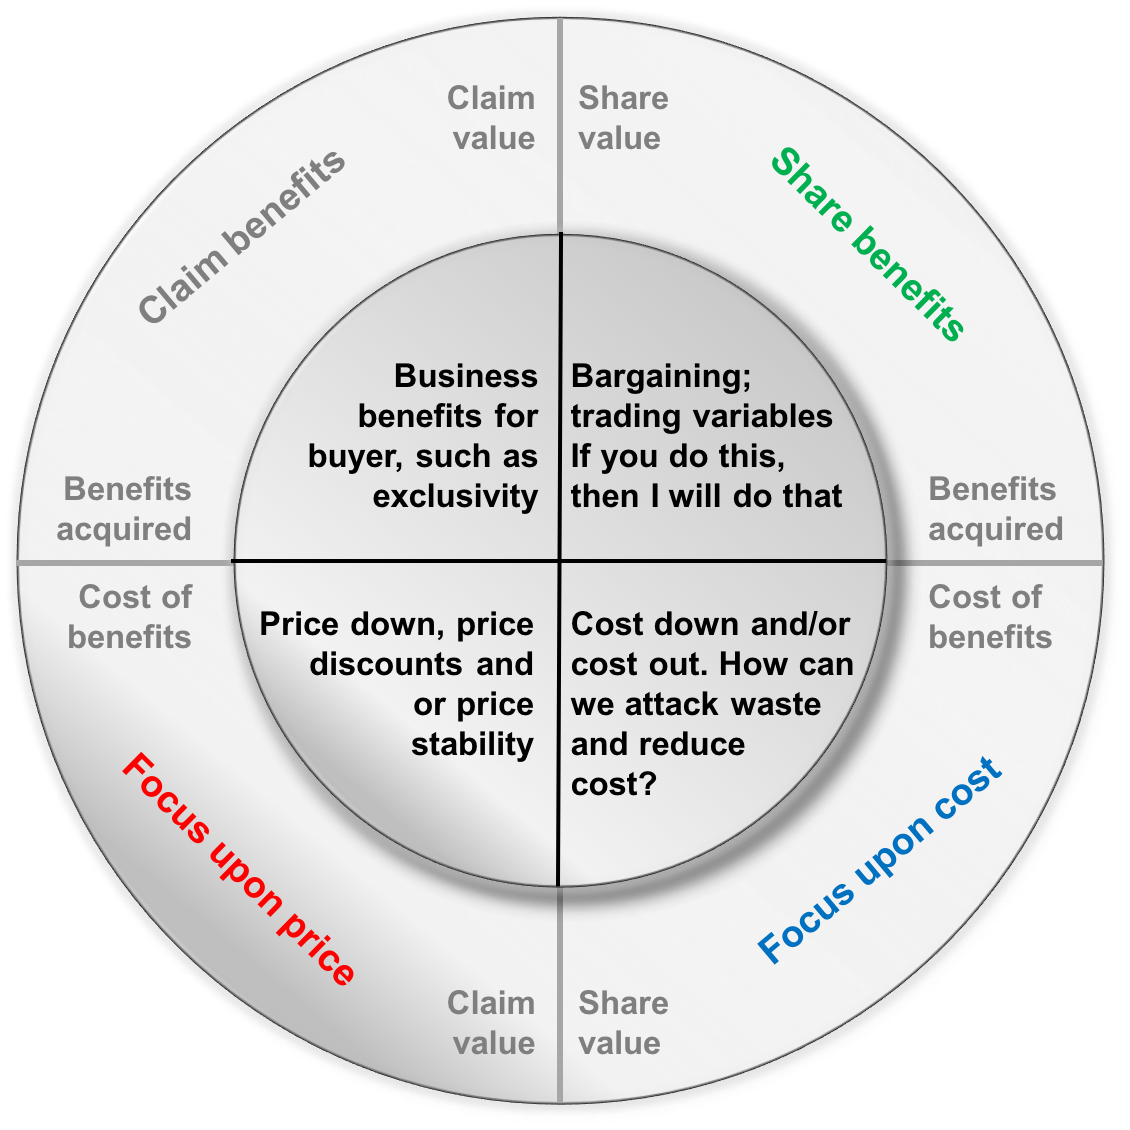
In the model, 'above the line' refers to business benefits and 'below the line' refers to the cost of acquiring the benefits. To the left of the central vertical line is 'claiming value'; the "I win / you lose" world of negotiating. Peter lives in the red zone, chiselling price. Valerie might be here too, but she is also likely to want to set negotiating objectives focused upon non-commercial matters. In the example above, Valerie has identified exclusivity as a business benefit. It may benefit the buyer, either disproportionately or completely.
Valerie and Peter may talk about reducing total cost, and in the example six sigma, lean or other cost down/ cost out initiatives are represented as sharing value, as neither party has to give up something, and both parties may benefit. And in the green zone, Valerie is all by herself, trading concessions in order to get a win/win outcome.
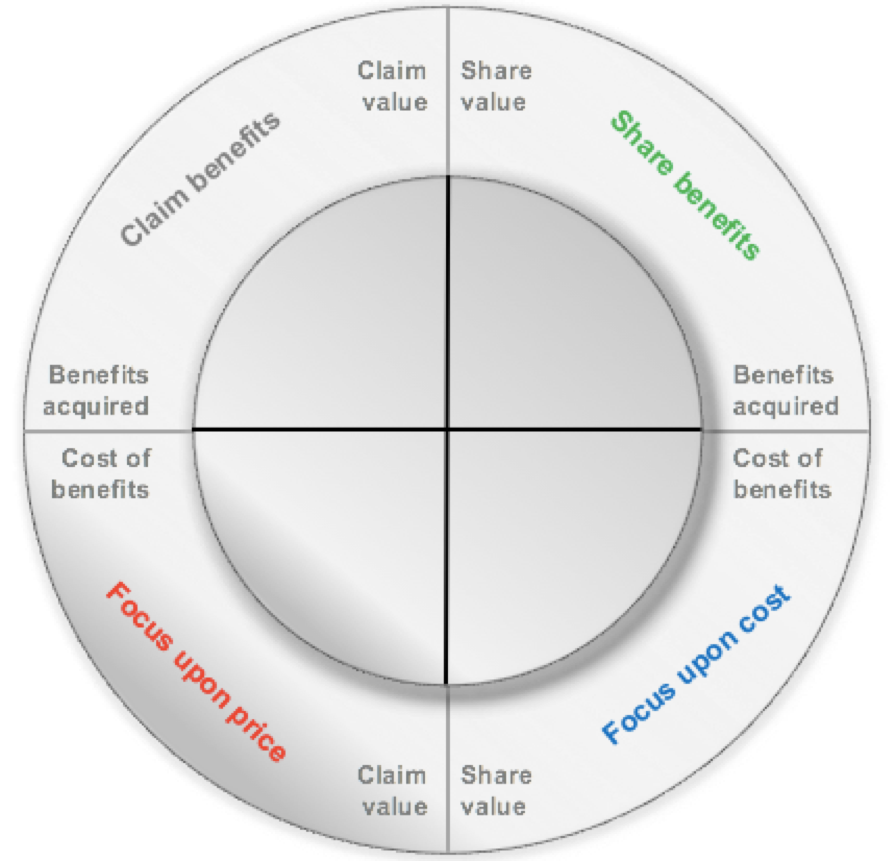
So there you have it, Valerie and Peter used as the personification of old school tactical purchasing and value-based procurement. I have created a blank template for you to use in your next negotiation. Simply print out the template, and put a dot in the relevant section of the graphic each time you make a statement. If you have dots all over the place by the end of the negotiation, well done! And if you have dots mostly in the red zone?
Can we have a word?
The case of the missing diamond
21/04/19 - 14:37 Filed in: Thinking

Can you see it? The missing diamond? If you look really hard I think you will be able to spot it! The clue is in the text at the bottom of the photograph. If you can't work it out, I will drop some clues in my post and give you the answer at the end of the article.
Visualisation tools
I have written previously about the belief that capability with one particular tool leads to better performance. The pitch for visualisation tools like PowerBi and Tableau is that seeing the data graphically will reveal patterns and trends that we simply cannot detect when looking at numbers. And through a process known as voodoo we will therefore make better decisions. Actually, that is unfair. Predictive analytics is based upon identifying relationships between two sets of variables:
- explanatory variables
- predicted variables
Analysis of the explanatory variables is used to predict outcomes in the predicted variables. I tried to explore how that works in practice in this post. Clearly the accuracy of the prediction will be driven in part by the quality of data and in part by the assumptions about what really "explains" variation in the data set. My contention is that we need to acknowledge the impact of external variables that we may not be able to measure easily.
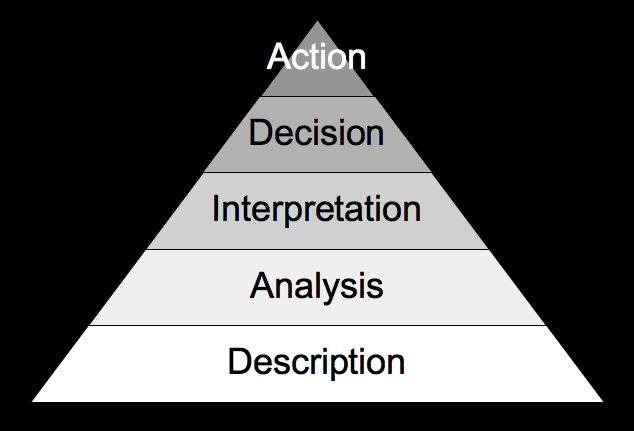
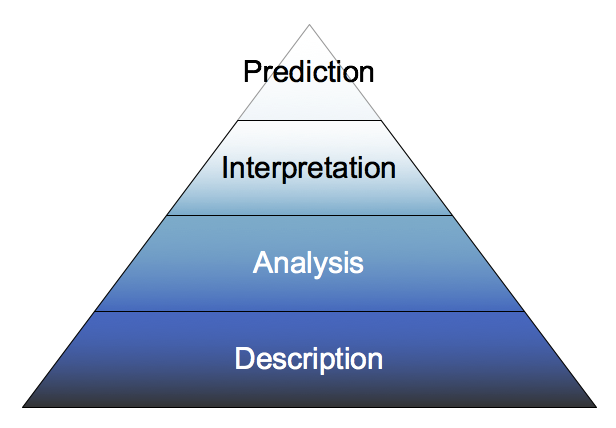
The point is that decision making is not a simple linear process like this; Facts + analysis = better choices. The next time you review a procurement strategy, consider what proportion of the strategy document is describing the situation, how much is analysis, and what is the interpretation of the output of the analysis.
Dino Brugioni
For example, in early autumn 1970 a CIA analyst named Dino Brugioni looked at the photograph above (taken by a US U2 spy plane) of construction activity on an island called Cayo Alcatraz near the port of Cienfuegos in Cuba. Description would be that it is a photograph of an island. Analysis revealed the presence of multiple sports facilities on a relatively small island.
Interpretation is where things get interesting. For there to be so many sports facilities, there must have been lots of construction workers. To play soccer you need at least 22 players, so it was reasonable to assume at least 20 - 30 (relatively young) men were stationed on the island. What were they building? Was it connected to the jetty on the south side of the island? After all, Cienfuegos is a port. It was Brugioni's prediction that the photograph revealed something important, and within days the photograph was on National Security Advisor Henry Kissinger's desk, and a few days after that Kissinger persuaded President Nixon to make the decision to take action. Triggered by this photograph!
The point is that when we analyse spend data, or supply markets, we may well describe the data, and even use tools of analysis. But we also leverage judgement and experience to reach a decision. Tableau or PowerBI do not transform decision making by themselves. Interpretation requires knowledge, experience and wisdom. And there is no point looking backwards in time unless we use that knowledge to make better decisions about what to do in the future.
The explanation
In the case of the photograph, Brugioni's analysis was that there were lots of sports facilities present on a small island, apart from a facility for the most popular sport in Cuba, beisbol. Why would there be a soccer pitch, but no baseball diamond? Why would the construction workers build permanent sports facilities? Because the base was being built by Russians. Cubans play baseball, Russians play soccer. Brugioni predicted that the facility would become a permanent Russian naval base, and escalated the advice immediately. Nixon's intervention stopped the construction of the Russian naval base, and it was never finished. The case of the missing diamond!
So what?
Cool story, bro, but so what? The 'so what' is:
When you analyse situations, there may not be a missing diamond, but there will be some facts staring you in the face and some facts missing.
Analysis is better than simple description, but analysis needs interpretation to make decisions
When analysing a situation, it is important to try to be objective about what is happening, and what is not happening
Interpretation involves synthesising multiple information sources to understand the 'what' and the 'why'
In this case, inductive reasoning is needed to 'join the dots' using information not present in the photograph
In many cases we will not have all the data we would like to have to make a decision
Experience, insight, hunches and 'wisdom' are part of the voodoo involved in making decisions in uncertain situations
Whether a spend analysis or a market review, we only look backwards in time to better inform our future choices
Our decisions are future-focused, and whether developing a category strategy or limiting the threat of nuclear war, if there is no action, there is no point
Visualisation tools are like the U2 spy photograph. They give us a new way at looking at a situation. But no tool can reveal what isn't there, and we all need to be as insightful as Dino.
Here is the island today, courtesy of Google Earth. Nature has reclaimed the island!

Bananas and legal services
21/04/19 - 13:55 Filed in: Procurement
The Australian Bureau of Statistics publishes Producer Price Indices for a variety of categories. Here's how the ABS defines Producer Price Indices (PPI):
The Producer Price Indexes measure price changes, over time, in selected industries of the Australian economy. Transactions for each of these industries may cover purchase and sales of thousands of different products at a wide variety of prices. The sheer volume and complexity of these transactions mean that a non–probability sampling method is more practicable and efficient than probability sampling methods. A non–probability sampling method involves choosing producers based on the relative importance of the products they sell or buy, who they sell to or buy from and the nature of their pricing policies.
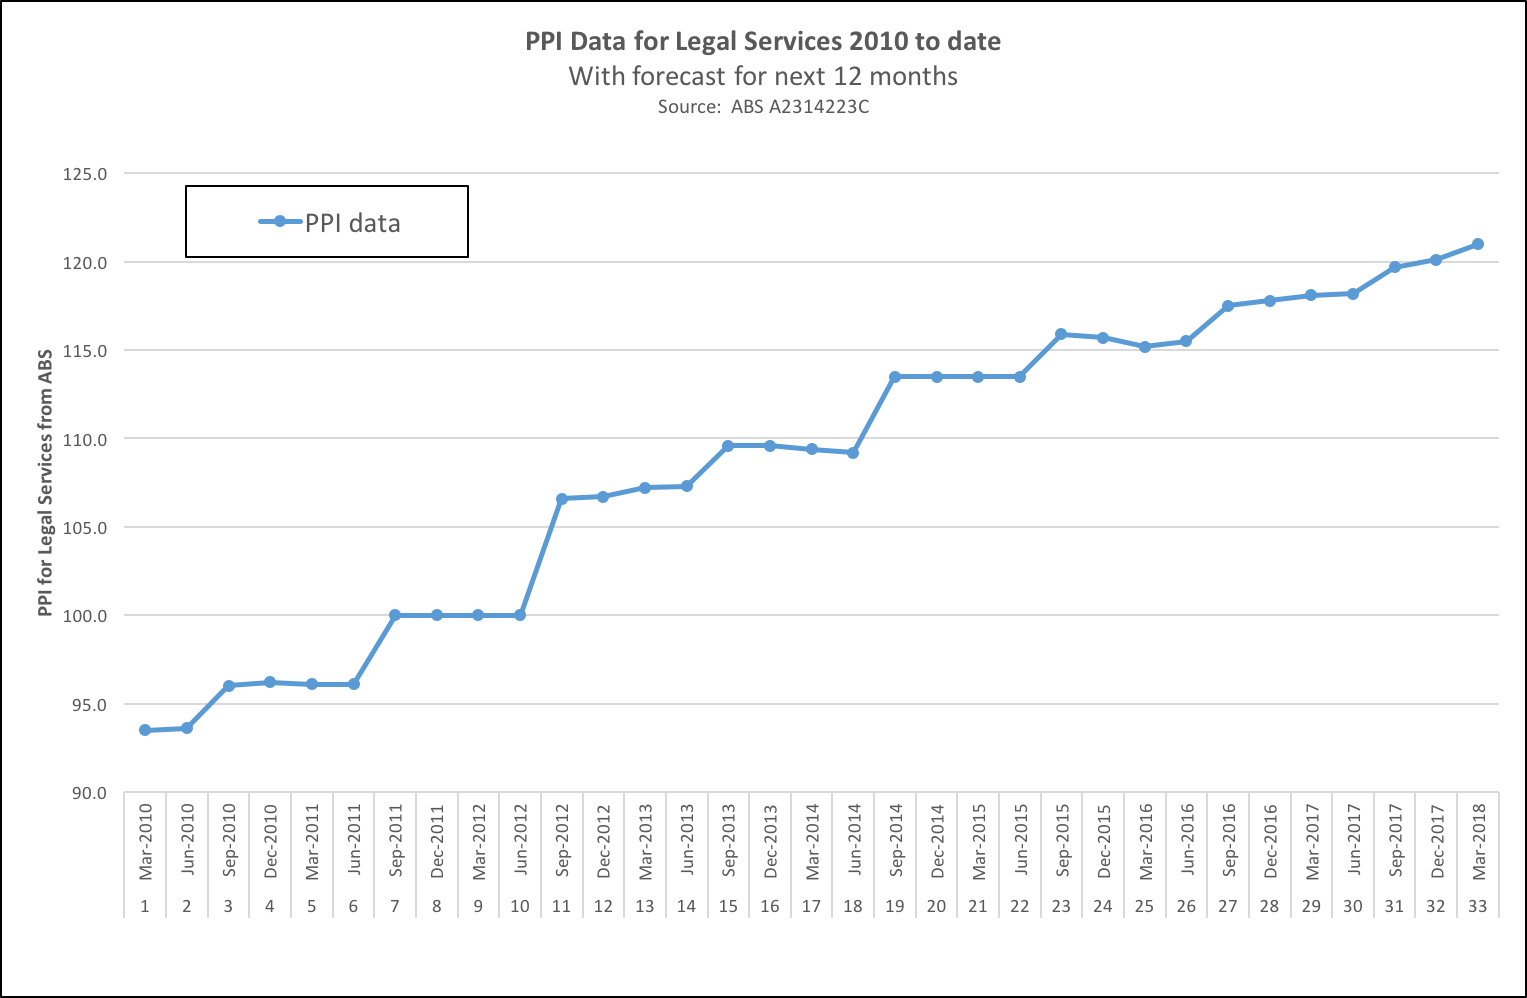
My chart is for Legal Services, and what is remarkable (at least in my opinion) is the 'stepped' pattern of rate increases that seems to happen in the September quarter each year. Have a look at the peaks in the red line (the % change from the previous quarter) in the chart below and note the quarter when the PPI moves up by the largest amount.
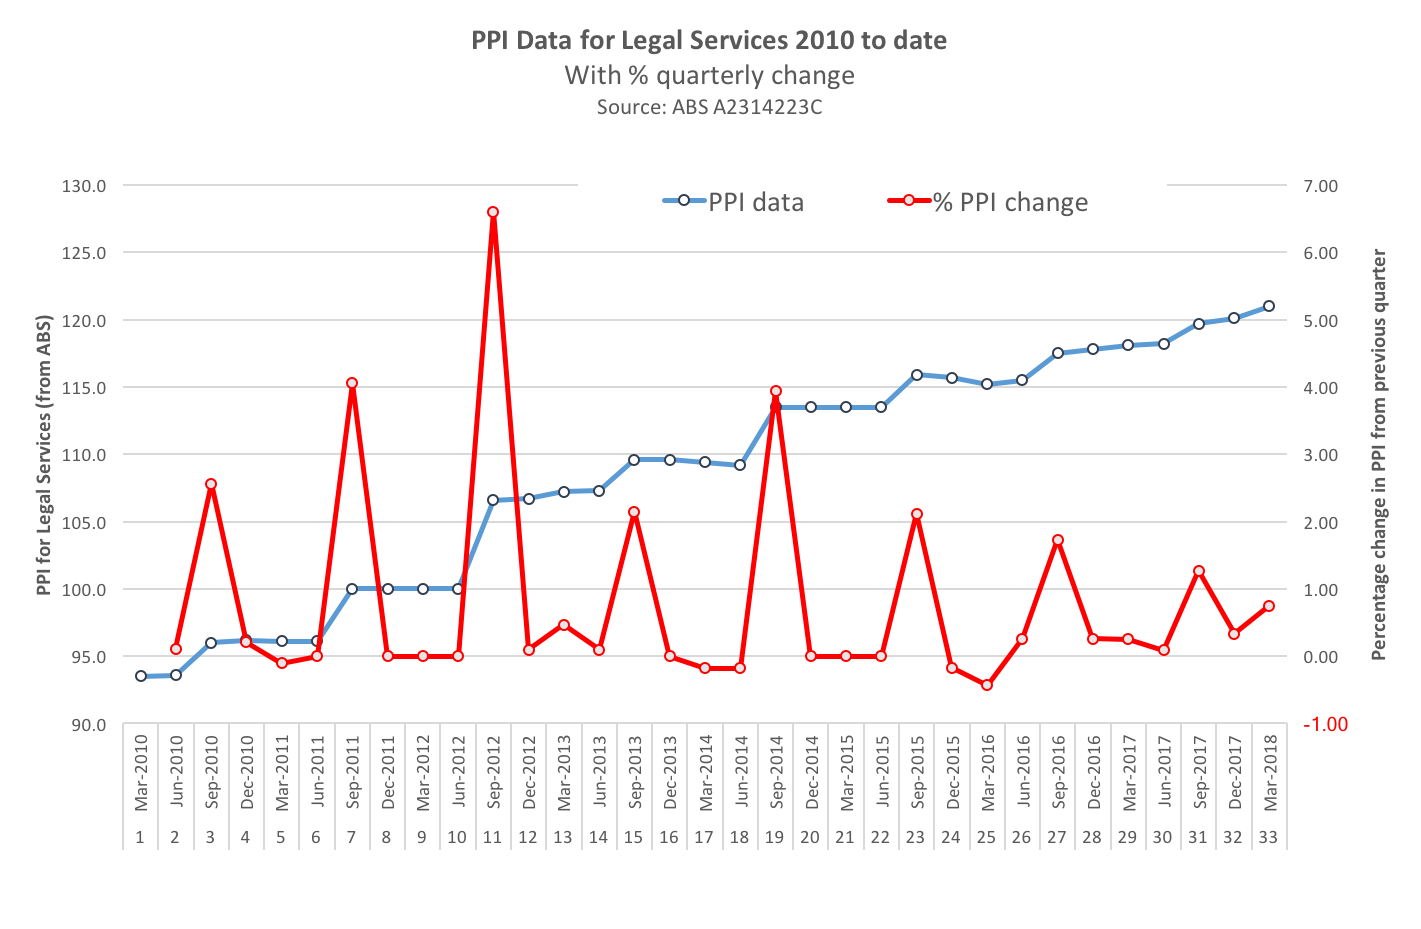
t is September, isn't it?
The 'so what' is:
legal services pricing appears to follow a seasonal pattern
legal practices appear to raise rates in July, August and September
the volatility in PPI appears to be reducing, with lower peaks and shallower troughs
the start of the calendar year appears to be the best time to buy legal services
March 2018 saw PPI increase in the first quarter for the first time since 2013
Having written about the difference between a facility with Excel and strategic sourcing, I taught myself how to 'de-seasonalise' data using 'centred moving averages' and undertake trend and regression analysis using Excel. Watching the videos took 45 minutes, and creating the charts another 15 minutes. But that hour of investment allowed me to forecast what the PPI is likely to be in the next quarters:
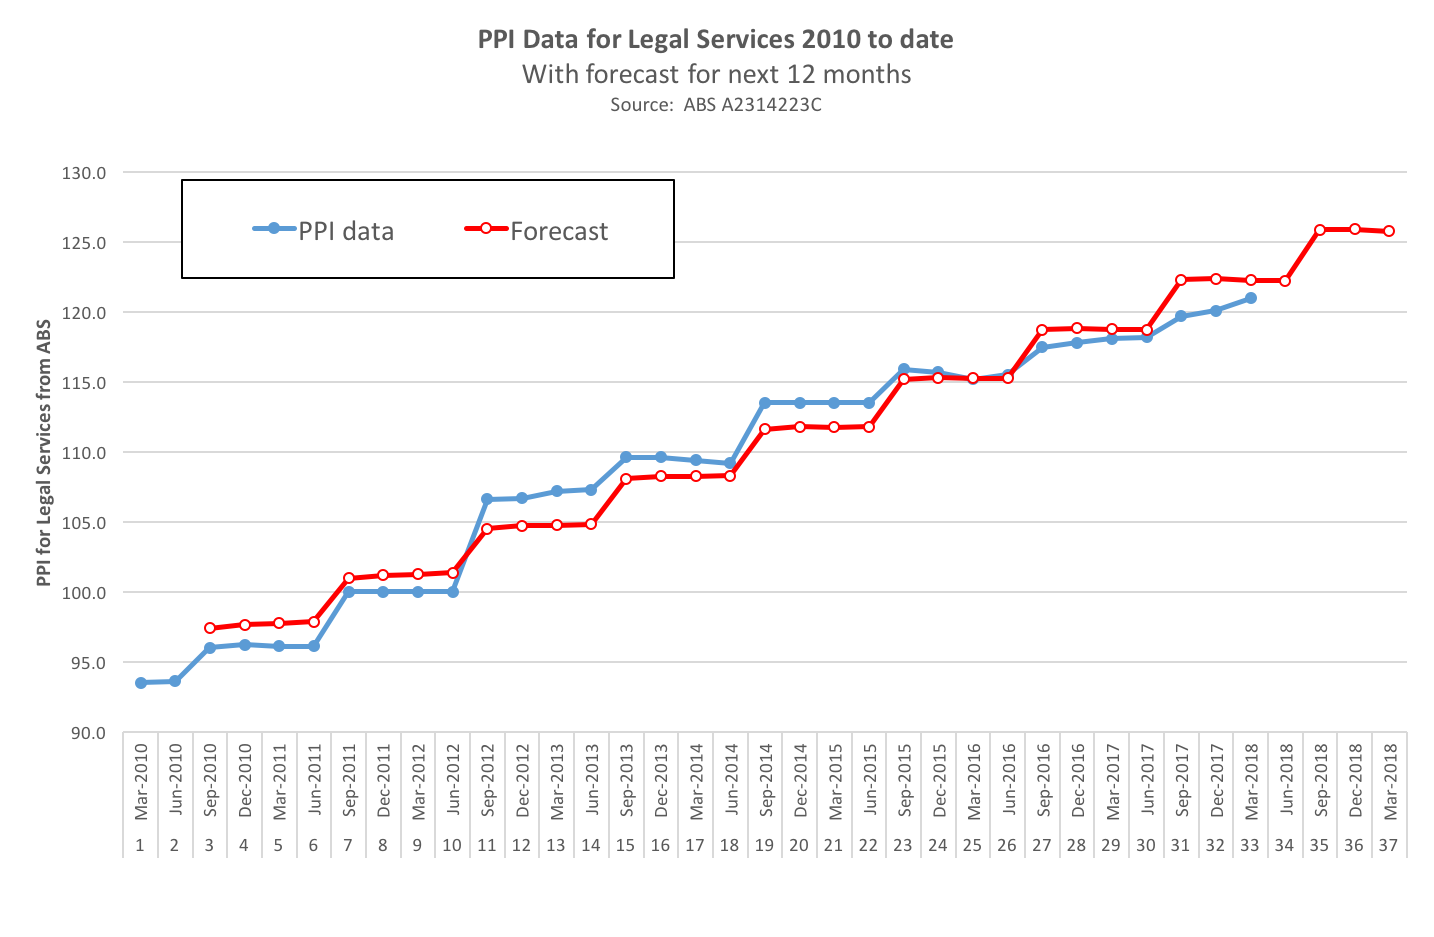
It will be interesting to see if I'm right! The point about analytics is that analysis is not an end in itself, it is only meaningful if it helps reveal patterns and build understanding.
So what do you think drives seasonality in pricing of legal services?
"It is obvious, numpty" I hear you say. "Legal practices raise their rates in July each year!"
But how does that explain what happened in March in 2012. Or March 2014. Or March 2016? Rates were decreased in each of these quarters. If your theory was correct, presumably legal practices all cut rates in March every year? That is not true, so we need to interpret why rates are seasonal and why they rise and fall following a pattern.
So I obtained some data from the ABS on sales levels in the relevant sub-category (Professional, Scientific and Technical). It is true to say that the category is broader than just legal services, but it is the best proxy measure that we have. I correlated sales levels in each quarter with the PPI in the next quarter, and the r value is 0.65 and the r-squared value is 42%. Hardly earth-shattering, but a reasonable hypothesis;
Sales in the last quarter have a direct impact upon pricing in the next quarter
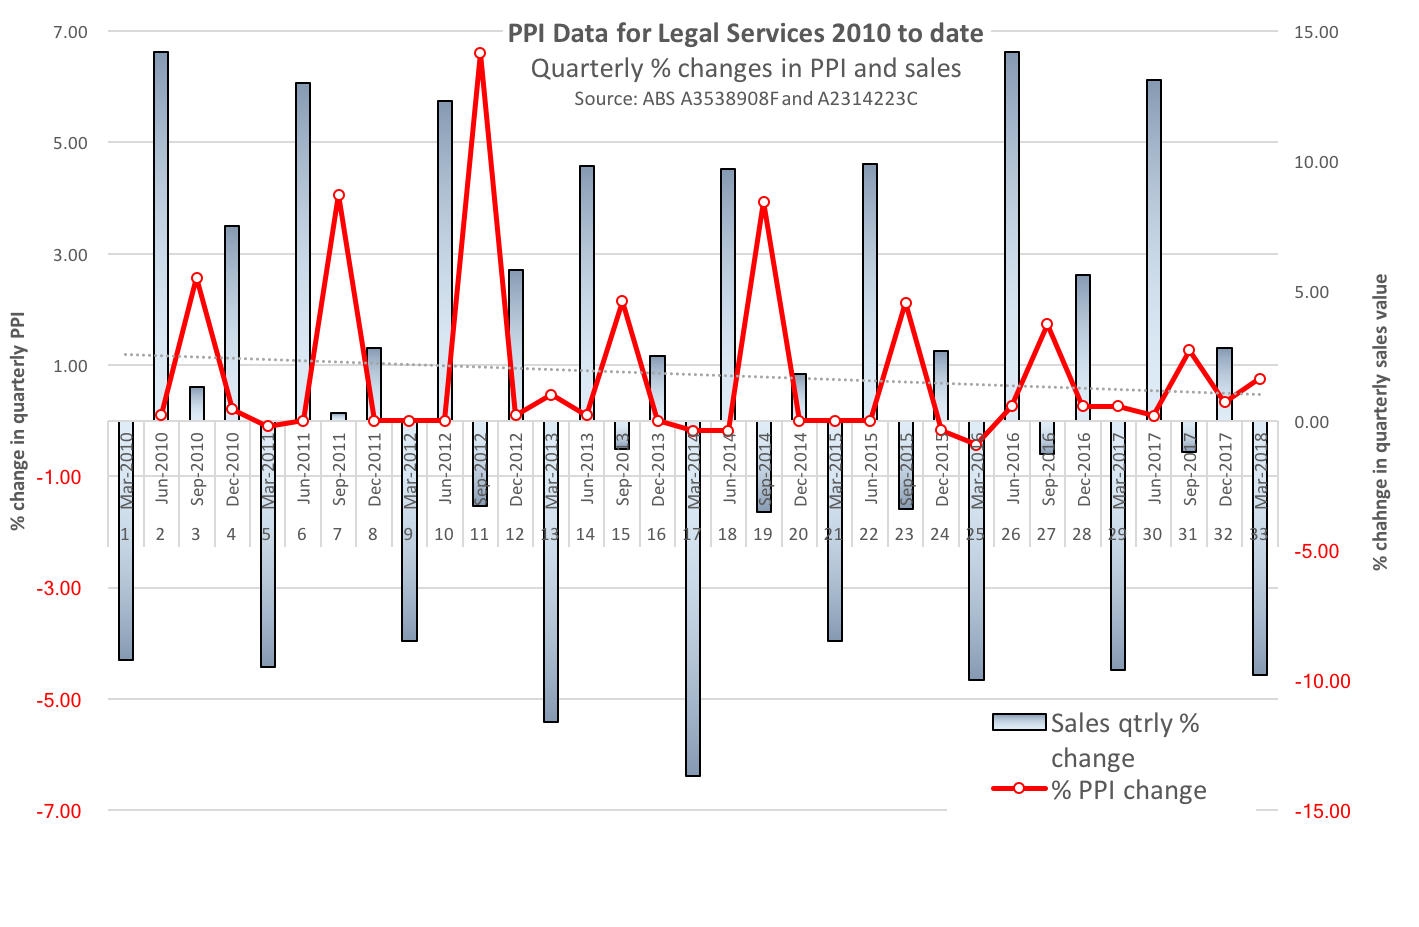
To test my ground-breaking theory that legal practices vary rates with utilisation levels, let's examine some recent quarters
In the quarter ending in June 2016 sales went up nearly 15%.
The next quarter rates went up because the practices were busy and didn't need the work
In the quarter ending in September 2016 sales levels went down.
In the next quarter rates still went up, but by a tiny percentage
Sales levels in the quarter ending in December were up
In the next quarter, rates stayed the same
In the quarter ending in March sales were down
In the next quarter, rates were held at the previous rates.
In the quarter ending in June 2017 sales were up again
In the next quarter, rates went up again!
So it appears that:
sales volumes for legal practices are volatile
sales volumes for legal practices are seasonal
Q1 (in the calendar year) is quiet, and rates are either stable or cut to win work to drive utilisation. Q2 is usually busier
Rates are routinely increased in July, August and September when there is an annual rate review
Q3 is usually quiet, and things pick up again in Q4
Take aways
Pricing for legal services is dynamic. Rate cards may be set annually, but pricing varies with utilisation levels
Utilisation levels vary throughout the year. The start of the calendar year appears to be quieter for legal practices
Inviting annual rates from legal practices (for example 'ceiling rates') requires the legal practice to estimate utilisation levels
If you must fix pricing for 12 months, the best time to invite pricing is between January and March.
Pricing for legal services is becoming less volatile
Rates are still increased when the practice is busy, but rate reductions to chase business appear to be less popular with legal practices
There appears to be an industry-wide change in pricing practice. happening.
This may be related to the rise of panel arrangements for legal services, and the increasing role of procurement in this category
So what do bananas and legal services have in common?
When retailers have lots of bananas to shift, they cut the rates. At least bananas can be stored for another day. A day of no utilisation for a legal practitioner is lost forever. The key to acquiring legal services would appear to be understanding utilisation levels.
And a calendar
SWOT= Stupid waste of time
21/04/19 - 12:06 Filed in: Thinking

It is easy to criticise the use of four-box models. "Not another four-box model!" the team groan. But whether Ansoff's Matrix in marketing, or the BCG's Market Share / Market Growth Matrix in strategy or our beloved Kraljic's Matrix in procurement, they do help create repeatable and transparent decisions.
Well, some do.
SWOT may have a place in strategy session to engage the team after lunch, but does it have an application as an option evaluation tool?
SWOT= Stupid Waste of Time
One four box model that warrants critical analysis is SWOT Analysis. I am in the process of writing a category strategy for a client, and the governance requires that I review each potential option using a SWOT Analysis. No other four box model, not even the procurement community's two most favourite models (which I have used anyway). No, just SWOT
SWOT= Stupendous Waste of Time
Let's apply the tool to a fictitious procurement project and imagine that:
- the requirement is a one-off project
- the project is complex and has some uncertainty
- the client is a relatively small customer in the market
- larger suppliers may not be interested
- smaller suppliers are less likely to be capable to deal with the complexity
Let's review two project dimensions using the SWOT framework:
Project scale
- Project scale is a strength because the client is unencumbered by historical baggage and can start afresh
- This is a weakness because the client has no recurring demand to leverage
- This is a threat because suppliers may not be motivated to participate as there is no ongoing business
- This is an opportunity because suppliers can potential build a relationship with a new client
Project complexity
- Project complexity is a strength because it means the client can access external expertise to help reduce the complexity
- This is a weakness because the client has to rely on external consultants to support decision-making
- This is a threat because if the larger suppliers do not participate the use of local suppliers may increase complexity
- This is an opportunity because working with local suppliers will develop their capability
I could go on, but I think you get the point. You can define project dimensions in whatever way that you choose. Or rather, whatever way the person with the marker pen chooses.
SWOT= Strategic Waste of Time
The criticisms of SWOT are as follows:
- There is no rationale as to how project dimensions should be classified
- The identification of weaknesses depends upon the level of insight that the team have about their relative capability
- The same dimension can be classified in a variety of ways, which makes the choice of perspective a subjective choice
- The logic that strengths and weaknesses are internal and threats and opportunities external classifies the source, not the impact
- The tool is a qualitative tool that gives the illusion of 'analysis' but provides no objective or repeatable methodology
- The use of the tool engages the team in a participative way, raising expectations that the tool will point to the next steps
- In fact, SWOT consumes time and raises expectations but provides no indication as to what to do next
- The idea that you 'leverage the strengths to take advantage of the opportunities' is only as valid as the choice of strengths and opportunities
- Once the flip charts have been written up, and the SWOT analysis recorded, the next steps are no clearer than before the 'analysis'
- What has changed is that expectations have been raised that the team have 'addressed the problem'. In fact, they have admired the problem
Significant Waste of Time
If you think I'm being harsh, read this, or this, or this. And if a consultant recommends that you use SWOT as part of category planning, ask them to provide you with a worked example showing exactly how the analysis leads to a decision. Ask them to write guidelines on how to use the output of the 'analysis' to decide what to do next
And then politely suggest that they watch this, or this or even this video, and request that they compare the effectiveness of SWOT with weighted factor analysis as an option evaluation tool using weighted factor analysis.
But not SWOT!
Do you agree? If you think I'm maligning SWOT, let me know!
Commercial Acumen #4
21/04/19 - 11:05 Filed in: Commercial acumen
Tactics when the balance of power is even, and neither party 'needs' the other Read More...
Commercial Acumen #3
21/04/19 - 11:01 Filed in: Commercial acumen
The absence of commercial acumen is relatively easy to spot! Read More...
Commercial Acumen #2
21/04/19 - 10:47 Filed in: Commercial acumen
The internal auditor was an unreconstructed tender jockey… Read More...
Commercial Acumen #1
21/04/19 - 10:31 Filed in: Commercial acumen
An inkjet printer for $50? What could possibly go wrong? Read More...